Interface graphing is an important feature on Mikrotik RouterOS that lets you monitor your utilization and aids you in making informed decision concerning bandwidth upgrade. Organisations are looking at ways to cut cost while deriving the best of internet services from their ISPs and paying less for internet service is one of those areas where organizations do not want to pay much howbeit they need fast internet.
While there are many ways to set up interface graphing across different routers, Mikrotik has simplified this process on its platform and in this post, I will share with us.
Assuming you have a dedicated link from an ISP and you intend to have your own graph of utilization, then you need to enable interface graphing on the interface connecting to the ISP equipment. The commands below will have create a graph of utilization on Ether1.
tool graphing interface add interface=ether1

After the command has been entered, access your router via a web browser. See below

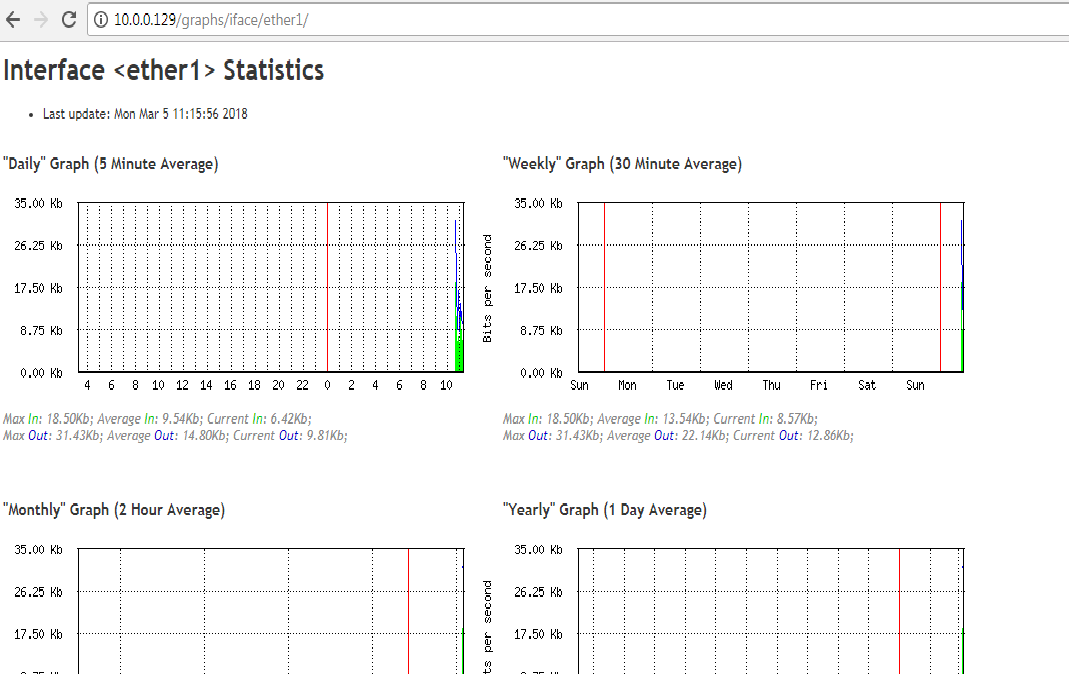
Click on graph and a page with links to the graphs you have created on the device will be displayed. Click on any of the links to view its graph. A device can have multiple graphs for different interfaces. See below: