
If you are a network engineer working for with an ISP that services a large customer base, chances are that you are using Cacti or PRTG. While PRTG is a paid application, though there is a free version with limited sensors, Cacti is a free application that does exactly what PRTG does in a slightly different way. Your customers will like to have access to their utilization portals where they can monitor their bandwidth consumption in real time. I am going to show you how you can create user accounts and add their graphs. For example, if you create an account for user A, only user A’s graph will be attached to that account. What this means is that user A will only see graph A when he logs into his utilization portal. See how it is done below.

Login as an administrator and do the followings:
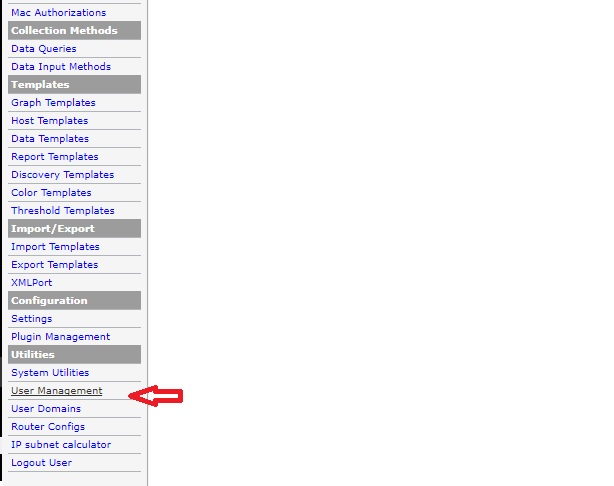
>> Scroll down and click on user management
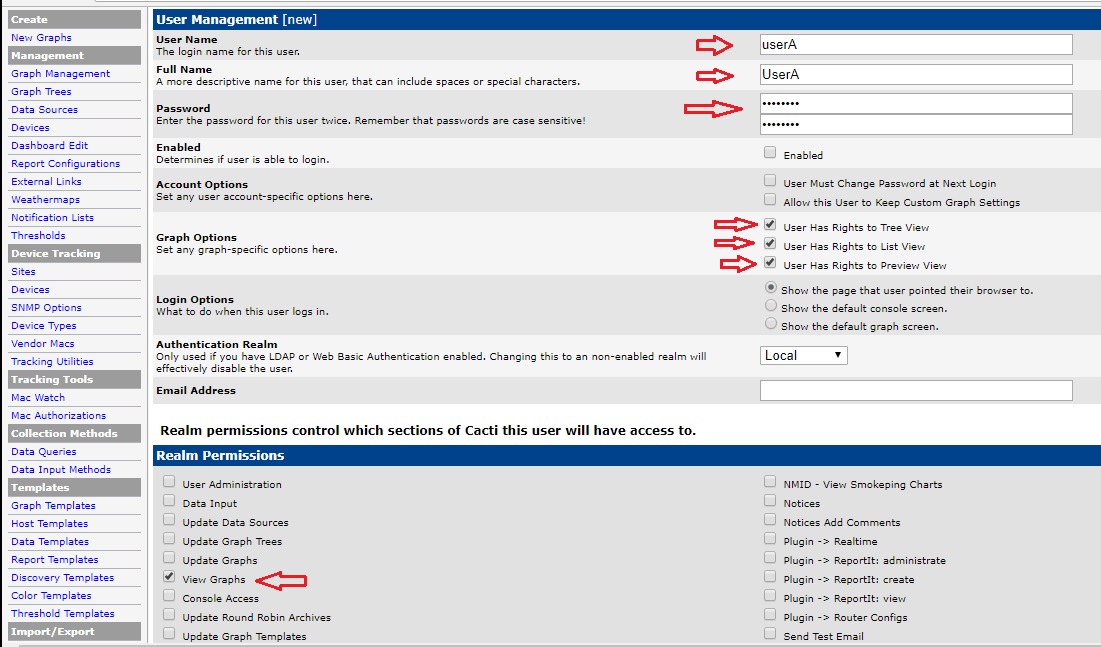
>> Click on add at the top right corner of your screen
>> Enter username, full/descriptive name, password, click on view graph,and other attributes highlighted on the second image below. Check the box to enable user account. Scroll down and click on create.
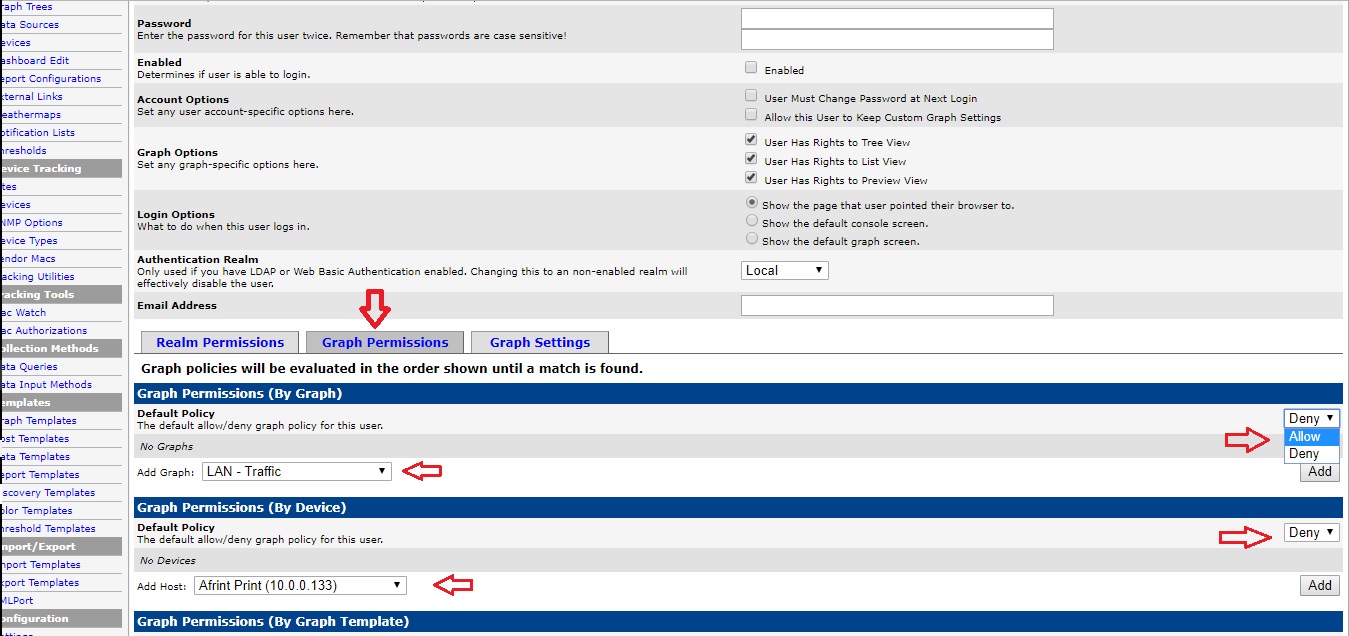
>> Click on graph permission
>> Choose the graph to add to the user account, click on the arrow beside deny at the right side of the screen and choose allow, then click add.
>> Scroll down and click on save.
After that, login with the username and password and click on the preview or list view to access your graph.

That’s how to create user accounts for customers in Cacti. If you experience any difficulties doing this, please leave me a comment and I’d be glad to help. Thanks for reading and, stay safe.