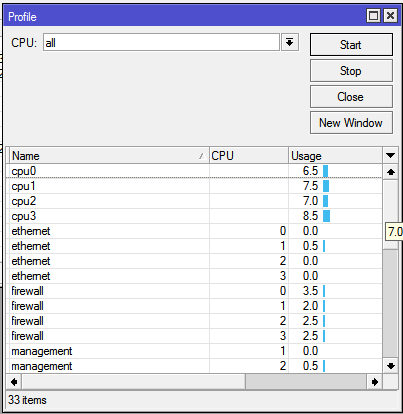
Mikrotik profile tool allows you to manage cpu utilization and avoid an overhead on your router’s processor. With hundreds of routerOS features available on Mikrotik routers, it not not unusual to find network administrators activating so many functions on a router- even the ones that are not needed.
One of the features available in the tool section of the mikrotik routerOS is profiler. this feature allows you to see the cpu usage for all processes running in routerOS. By using the mikrotik profile tool, a network admin will be able to identify which process is using most of the CPU resources.
Read: How to use Mikrotik torch to identify the cause of network congestion
How to use the Mikrotik profile tool
To find out which of the routeros processes is taking up the CPU, simply click on tool>profile. Select a cpu and click on start. Alternatively, you can select ‘all’ and click on start. This will profile all active cpu usages for available core on the system. See example below:


You can use the total option to get the sum of all cpu usage.

Heavy CPU utilization can slowdown the performance of a network device thereby causing slow browsing experience. Having used the mikrotik profile tool to determine the cause of such slowness, attention can be focused on the RouterOS feature responsible for high CPU utilization.
Also read: How to configure firewall on your Mikrotik router to protect your network
For example, where the result shows a high CPU utilization caused by multiple firewall filter rules, the rules can then be modified. Multiple firewall filter rules can slowdown your router’s performance.
If you enjoyed this tutorial, please subscribe to this blog to receive my posts via email. Also subscibe to my YouTube channel, like my Facebook page and follow me on Twitter.
